Fed up with the Fed?
How Washington DC Impacts your Property Values
Unlike homes, vacant land, or self-occupied business properties, investment real estate values are driven primarily by two observable metrics: property income and prevailing cap rates—both of which reflect broader forces such as interest rates, growth expectations, and capital availability.
Net Operating Income
To accurately compare apples-to-apples income across different properties, the real estate industry developed a metric called Net Operating Income (“NOI”). The NOI of any investment property is based on the same simple formula:
NOI = annual gross revenues – annual property-level operating expenses
NOI does not account for amortization, depreciation, income taxes or debt service. Rather, this metric focuses strictly on the operational profitability of a property, regardless of any current or future owner’s tax or financing expenses.
When determining the market value of an investment property, it is accepted practice to reference the projected NOI of a property as of the valuation date (or purchase date). In other words, NOI is usually a forward-looking number.
Capitalization Rates
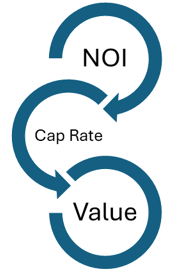
A “cap rate” is the NOI that a buyer (or a market of buyers) demands to receive from a specific type of property, expressed as a percentage of the property’s implied purchase price:
Cap Rate = Projected NOI / Property Value
Here are three examples of property types with the same NOI, but different prevailing cap rates impacting their values:
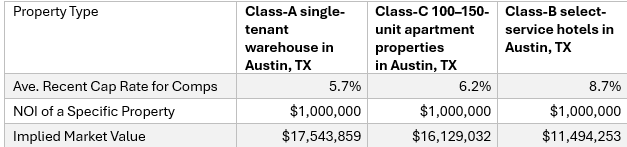
If someone asks, “What is the current cap rate for class-C apartments in Austin, Texas?”, this is simply real estate jargon for, “Based on market data from recent sales and current listings of class-C apartment buildings in Austin, Texas, what has been the average rate of each property’s NOI as a percentage of its sale price?”
In the above table, each category of property has a different cap rate. Cap rate averages can be very broad (all single-tenant industrial properties in the Southeast) or very specific (6-10-unit retail strip centers with dedicated parking in a one-square-mile neighborhood of Atlanta). In our example, there is one property in each category with an NOI of $1 million. The implied market value of each property differs based on its cap rate.
Many factors contribute to the differences in cap rates between property types, but the five most important are:
· Income reliability
· Lease structure and duration
· Asset quality / capital expenditure risk
· Market depth (location and liquidity)
· Appreciation expectations
If you were to score two investment properties (1=low, 5=high) for each of these criteria, the property with the higher total score should have the lower cap rate.
Useful Comparison: Fixed-Income Instruments
The difference in cap rates between property types is intuitive—an investor will demand a higher yield from Property B over Property A if Property B presents a higher risk of capital loss and/or lower opportunity for long-term appreciation.
We see this same logic applied every day in the fixed-income securities markets. Suppose you want to invest in an income instrument like a bond or treasury, looking to generate an annual income of $10,000 from the investment.
On the day you plan to invest, U.S. 10-year Treasuries are yielding 4%. You then receive an email from a broker-dealer offering 10-year corporate bonds from a new tech startup (“TechMo”), also with a 4% coupon rate. Would you accept the risk of investing in TechMo for the same yield as U.S. Treasuries? Of course not.
Indeed, you would likely discover that, despite the nominal coupon rate of the TechMo bond being 4%, the actual yield is, say, 7%. Despite the par value of each TechMo bond being $1,000 upon issuance, the market value of the bond is less, because the prevailing yield for debt from small startup companies is much higher than 4%.
To receive $10,000 per year from the U.S government, you would need to invest $250,000 in 10-year Treasuries. To receive $10,000 per year from TechMo at a 7% yield, you would only need to invest $142,857.
The same concept affects the property values in the above table. Each of the properties is generating the same NOI—$1 million—but their varying cap rates result in widely different market values.
Admittedly, the comparison between real estate and bonds is limited. Unlike bonds, most real estate income is highly variable. Properties do not have fixed maturity dates for redemption at par. And real estate cannot be liquidated as readily as fixed-income securities. Nevertheless, if you understand how changes in interest rates impact the market prices of different categories of debt instruments, you can understand how changes in prevailing cap rates impact different types of income-generating properties.
Why Cap Rates Change Over Time
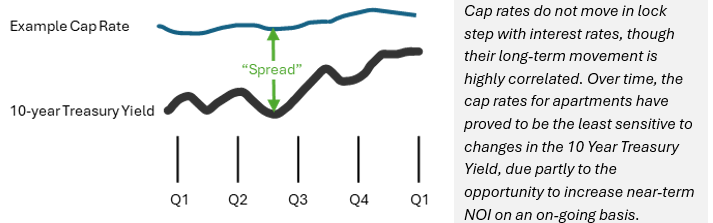
The 10-year Treasury yield (“10TY”) is the most widely referenced benchmark influencing cap rates, though it is not the sole driver. The “spread” between a particular cap rate (e.g., Class-A apartments in the Southwest) and the 10TY marks the premium that investors demand for the incremental risk of owning a type of property, compared to the “risk-free” rate of a US Treasury note.
Of course, the spread between the 10TY and any particular cap rate category is not a constant number. To explain why the spread fluctuates, economist Peter Linneman published a simplified formula:
Cap Rate Spread over 10TY = Operating Risk (O) + Liquidity Premium (L)
In other words, rising 10TY rates may not push cap rates proportionately higher if the perceived operating risk and available capital for a specific category of real estate have not changed. Conversely, the cap rate for a particular type of property could increase—in spite of stable interest rates—if other economic conditions have worsened for that category of property.
Positive factors for (O) and (L) would include significant population or job growth in a given market, increased demand for a specific type of property, or a looser lending environment. Systemically higher insurance rates, concentrated periods of overbuilding, or dramatic upticks in mortgage rates, on the other hand, can exacerbate both operating risks and the liquidity premium for a particular category/location of investment real estate.
Much like the CNBC pundits who confidently explain, every day, why the stock market moved that morning, only the hindsight of cap rates is 20/20. Even if we knew how much the 10TY would move next year, we could not predict the exact changes in cap rates.
Over time—and often with a lag of several months— changing interest rates ultimately will pull cap rates along with them.
How Changing Cap Rates Impact Property Values
All other factors being equal, the following rules apply to investment real estate over time:
· A property subject to a static cap rate will appreciate/decline in value proportionate to changes in its NOI
· A property with a static NOI will appreciate/decline in value proportionate to changes in its applicable cap rate
· A property will decline in value—even with increasing NOI—if its cap rate increases at a higher rate than its NOI
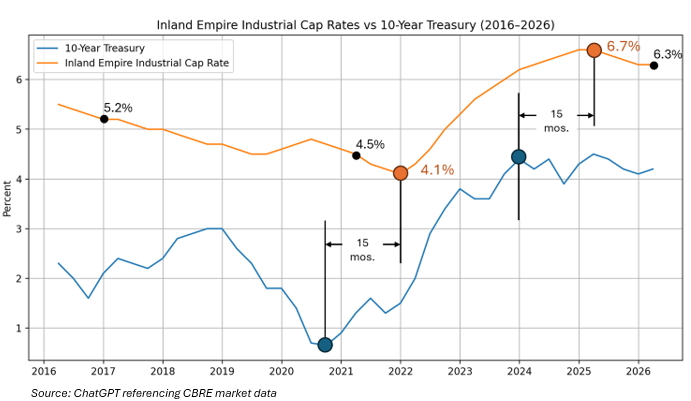
Let’s examine this last rule with actual data. The graph below shows the correlation between the 10TY and cap rates for industrial properties in the Inland Empire area of Southern California (Riverside and San Bernardino Counties). The trough of the cap rate (4.1%) occurred 15 months after the lowest point of the 10TY. Similarly, the peak of the cap rate (6.7%) happened roughly 15 months after the 10TY stopped climbing in early 2024. This is consistent with other cap rates lagging movements in the 10TY by 12-18 months in this cycle.
Using these numbers, let’s suppose you invested in a Inland Empire industrial building in March 2021, at a cap rate of 4.1%. The property had a 15-year NNN lease with an automatic rent bump of 1.5% per year. This means the tenant was responsible for all property expenses (taxes, insurance and maintenance) and agreed to increase the rent payment by 1.5% per year. If the NOI in March 2021 was $450,000, we can calculate the purchase price: NOI / cap rate = $450,000 / 4.5% = $10 million.
With an annual rent increase of 1.5%, the NOI of your industrial property looks like this:
· 2022: $456,750
· 2023: $463,601
· 2024: $470,555
· 2025: $477,614
· 2026: $484,778
Five years after buying the property, your NOI has increased by $34,778 per year, or nearly 8%. Great news, right? Yes—unless you need to sell the property.
Assuming your property aligns with the aggregate market data for the region, the cap rate today (March 2026) for your property is 6.3%. This means that a prospective buyer will demand a 6.3% NOI to purchase the building you bought for $10 million.
To calculate the market value, once again we divide the NOI by the cap rate:
NOI / cap rate = $484,778 / 6.3% = $7,694,889 value.
Despite your NOI increasing by a total of 8% over the five-year period, the cap rate increased by 40% (from 4.5% to 6.3%). As a result, your property value has dropped from $10 million to under $7.7 million—a loss of 23.05%.
To make matters worse, suppose you borrowed 50% of the $10 million purchase price in 2021 to buy the Inland Empire property, with an interest-only loan. Your gross equity multiple upon sale today (excluding transaction costs) would look like this:
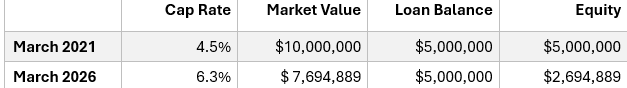
In this scenario, your gross equity multiple would be only 0.54x—despite owning an occupied property with a performing tenant.
Of course, an investor who bought this same property (assuming the same lease terms) in January 2017 and sold in January 2022 would have dramatically different results:
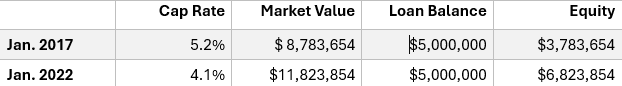
Here, an investor owning the same property with the same lease terms and the same financing—but over a different five-year period—would experience a 1.8x return!
Declining cap rates—amplified by debt—can increase returns significantly.
Rising cap rates—amplified by debt—can cause significant losses, even with performing properties.
Timing Often Trumps Property-Level Performance
The overall impact of interest rates on cap rates, and then cap rates on real estate values, can be seen in Green Street’s CPPI data below, which is an index of institutional-caliber investment real estate values (of the types of properties owned by DSTs, REITs and pension plans) across multiple sectors and geographies in the United States.
As a matter of official public policy, the Federal Reserve cares more about the cost of eggs than the value of your real estate investments.
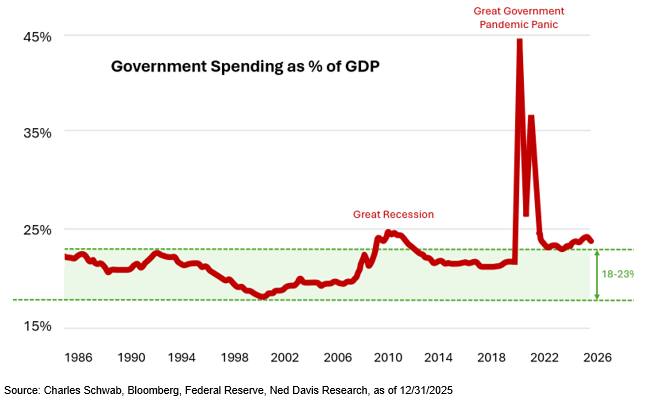
In 2019-2020, national cap rates surged in response to the economic panic of the pandemic. The Fed responded by, among other things, lowering interest rates, thereby setting the U.S. record in 2021 for annual real estate appreciation. However, the federal government recklessly flooded the economy with so much money that inflation ensued, triggering the Fed to reverse course and raise interest rates—dramatically. In only 24 months (2022-24) the 10 year Treasury yield nearly tripled from 1.5% to 4.4%. Indeed, from trough to peak, the 10YT soared from 0.52% to 4.98%.
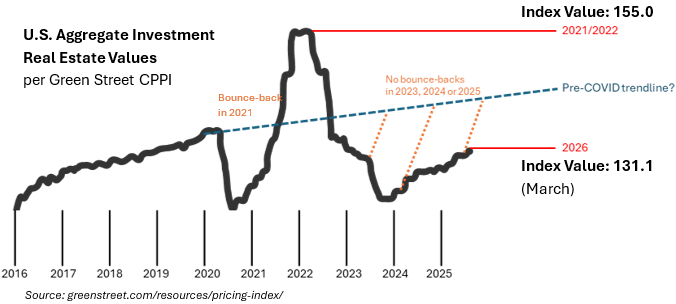
The post-pandemic interest-rate climb closely corresponded with the historic fall of real estate values. As of March 2026, the CPPI value was 131.1, down 15.4% from its 2022 peak of 155. Unlike past drops in real estate values, however, we have not seen a “bounce back”. Using 2016-2020 as a trend reference, an optimistic investor would not be faulted for anticipating a faster recovery, based on 2008-2011 or 2020-2022. Instead, aggregate real estate values have only recently climbed back to 2018-level valuations, and in a much higher mortgage rate environment. Adjusted for inflation, real estate values in some markets have been set back by a decade… all due to cap rates driven higher by Fed-directed interest rates that should not have been so low in the first place.
Bottom Line
2021–22 represented a long-term cyclical peak in valuations. Anyone who acquired commercial real estate at that time likely would not experience a return of capital until interest rates come down. 1031 investors from 2021-22 need to remember that they likely also sold a property at a high watermark price, especially if they owned a commercial, industrial or multifamily building. (SFR price performance, on the other hand, is highly market specific, especially since 2022.)
Investors entering the real estate market may experience a more stable cap-rate environment compared to 2016-26, though dueling concerns over inflation and economic growth still loom—not to mention armed conflicts, energy prices and budget deficits.
If cap rates can remain within a narrow band, we will return to a period when real estate fundamentals are highly relevant to long-term performance. Otherwise, the actions of the Fed may continue to be more important than your tenants, property manager or lease terms.
Even strong property performance (rising NOI) can be overwhelmed by adverse capital markets (rising cap rates), particularly when leverage is involved. This is one reason many investors seek diversification across multiple investments with varying lease structures and durations.
This information is for educational purposes only and does not constitute direct investment advice or a direct offer to buy or sell an investment, and is not to be interpreted as tax or legal advice.
Securities offered through Concorde Investment Services, LLC (CIS), member FINRA/SIPC. Advisory services offered through Concorde Asset Management, LLC (CAM), an SEC registered investment adviser. Insurance products offered through